All of us have seen the familiar picture of “Loading Circle” while watching videos streaming over the internet. Video Streaming is probably the largest consumer of the bandwidth today. Every user would want to avoid the loading circle as much as possible; or the ISP would rather measure and plan the network to make it work smoothly !
Video Streaming, especially real-time Video Streaming is done via RTP over UDP traditionally. This is soon giving way to HTTP streaming (over TCP) .
Performance of Video Streaming over RTP/UDP is measured with Mean Opinion Score (MOS). MOS is done by making a bunch of guys watch the video, ask them to rate their experience on a scale of 1-5 and take the average. Since doing this frequently would be too costly, experts (Ex:Video Quality Experts Group -VQEG) have created models that recreate the video as may have seen by a user to predict the MOS. This would normally be a function of
- packet loss (different types of frames )
- delay
- jitter
The models are many and sometimes complex and beyond the scope of this blog. These are measured at the receiver using specialised applications and some parameters are derived from packet captures (Ex: tcpdump).
With large amounts of bandwidth available per user, Video Streaming via HTTP/TCP has become the most popular form of Video Streaming. Since there is no loss involved due to TCP retransmissions, the quality metrics are also greatly simplified. The sample of metrics that are measured now are very intuitive Ex:
- Initial Buffering Duration (How much time did the user wait after the click)
- No of interruptions (How many times the user has seen the Loading Circle)
- Total Buffering time v/s Video Duration (How much time did the user waste waiting due to poor network!)
The above metrics are derived from real/simulated applications with lesser computation than the metrics for RTP/UDP.
Popular sites like Youtube, Netflix use more advanced adaptive streaming technique called Dynamic Adaptive Streaming over HTTP (DASH). DASH brings in changes between bit rates to allow for video to play based on network performance. Performance measurement with DASH is a topic for another blog.

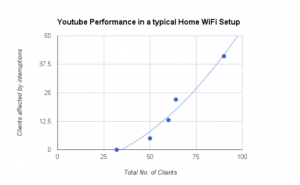
Above chart shows the performance of the network when a number of users simultaneously access a youtube link as measured by Alethea WiCheck. In this test, the clients configured NOT to use DASH (adaptive streaming). The network backbone supported an internet throughput of 80Mbps. This network seems to work well for up to about 50 Clients (5 interrupts). The AP used in the above set up is TP-LINK WDR4300 (802.11n). The test is done using Alethea’s WiFi load test solution SWAT WiCheck (more about the tool at http://wicheck.alethea.in)
